Street light fault detection by brightness
A filter, a detector, and a brightness score for every lamp in a night photograph. What it catches that an on-off check misses, what it cannot measure, and the unit we named wrong.
On this page
- Introduction
- Why a street light survey cannot just check on or off
- The pipeline
- Reject: drop the frames that cannot be measured
- Detect: find every lamp, and know what is not one
- Measure: one number per lamp, from ordinary code
- Compare: rank each lamp against the ones beside it
- What shipped, and what is design
- Deployment
- What the brightness score is good for
- Where the score stops
- What we got wrong: the number was not candelas
- What we would do differently
- Bottom line
- Sources
Give the tool a night photograph. It throws out the frames with nothing measurable in them, finds every street light in the ones that survive, and scores how bright each lamp is on a 0 to 100 scale. Python, YOLOv3 and OpenCV behind a Flask upload form, built in 2021.
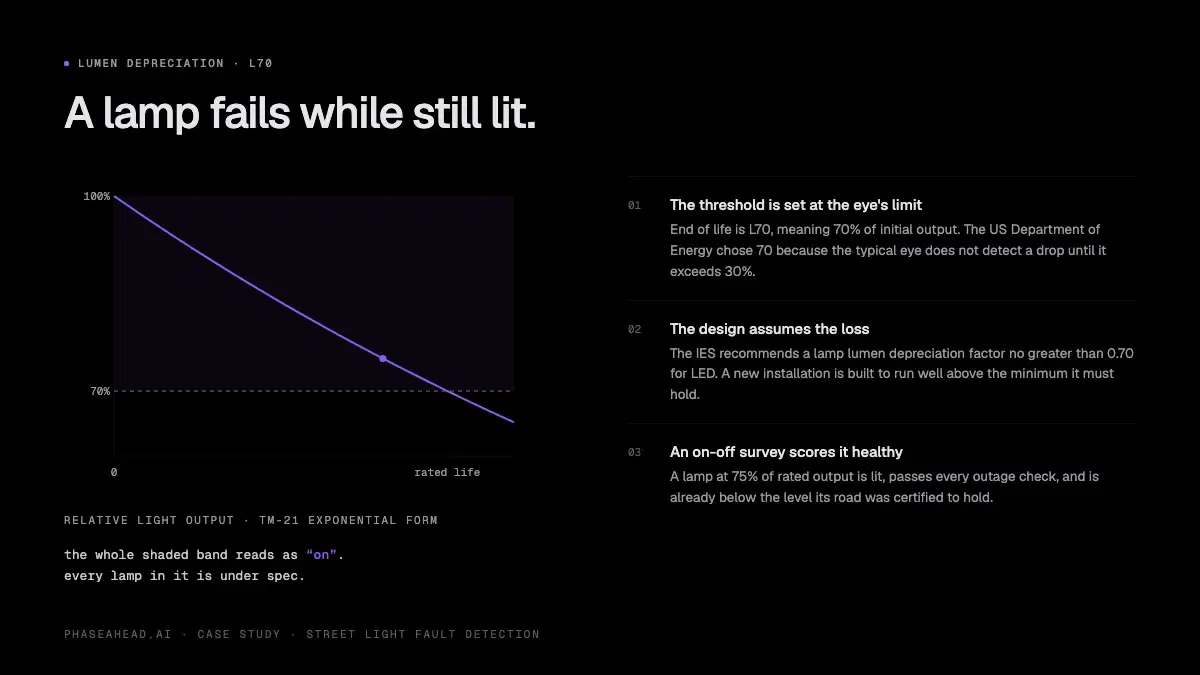
Scoring rather than counting is the whole point. A street light that has faded to 75 percent of its rated output is still on. It passes every on-off check, it looks fine to the crew driving past, and it is already below the light level its road was designed to hold. A survey that only asks "lit or not lit" is blind to it.
The score is comparative, not photometric. It tells you which lamp is down on the ones around it and where a dark gap sits. It is not a luminance reading, which is the word the interface printed above it, and that mislabel is the thing we got wrong.
TL;DR A night photograph cannot produce a compliant luminance reading, but it can produce a stable per-lamp brightness score, and most lighting maintenance questions are comparative anyway. A one-class filter drops unusable frames, YOLOv3 locates every lamp in the ones that pass, and deterministic code scores each lamp separately, so a survey ranks lamps by how far they have fallen instead of only finding the dark ones. The number it prints is a mean CIE
L*, a dimensionless perceptual coordinate, not the candelas we guessed at the time and not thecd/m²a road survey would actually want.
Why a street light survey cannot just check on or off
Street lights rarely fail dark. LEDs fade, and the fade takes years.
The lighting industry sets end of life at L70, the operating hours before a luminaire drops to 70 percent of its initial output. The US Department of Energy picked that threshold for one specific reason: the typical human eye does not detect a decrease in light until it exceeds 30 percent.
So the industry's own definition of a worn-out lamp sits exactly at the limit of human vision. Every lamp between new and worn out is losing light that nobody driving past can see. Lighting designers account for that loss when sizing an installation. A 2013 Pacific Northwest National Laboratory report describes an IES recommendation to use a lamp lumen depreciation factor no greater than 0.70 for LEDs when light quantity matters. The report also questions that blanket factor: it can misrepresent a product's performance and increase energy use. It is a historical design recommendation, not a universal threshold for replacing a lamp today.
EN 13201 sorts each road into a lighting class, and each class sets a minimum average luminance and the uniformity ratios that go with it. Three things put a road outside its class, and none of them looks like an outage:
- A lamp below its rated output. Lit, in spec on paper, under spec on the road.
- A dark gap. Every lamp on the stretch works and the road between two of them still fails, because spacing, mounting height or a grown tree put the light somewhere else.
- Uniformity loss. The average holds while the bright-to-dim ratio across the road surface drifts past what the class allows.
A luminance meter, pointed at the road under controlled conditions, catches all three. That is the instrument the standard is written around, and it does not scale. The geometry is why. EN 13201 Part 3 puts the observer in the centre of each circulating lane, 60 metres ahead of the first luminaire at 1.5 metres above the road, with conventional viewing distances running from 60 to 160 metres. A long clear stretch of carriageway is a precondition, which in practice means stopping traffic on every lane. The researchers behind that study put it plainly: the verification measurements that would stop cities oversizing their installations cannot be carried out effectively, because the traffic will not stop. A mid-sized city runs tens of thousands of lamps.
So you photograph it instead. Two things are in the way. Most of a night photograph is not a street light, and a photograph does not contain a measurement.
The pipeline
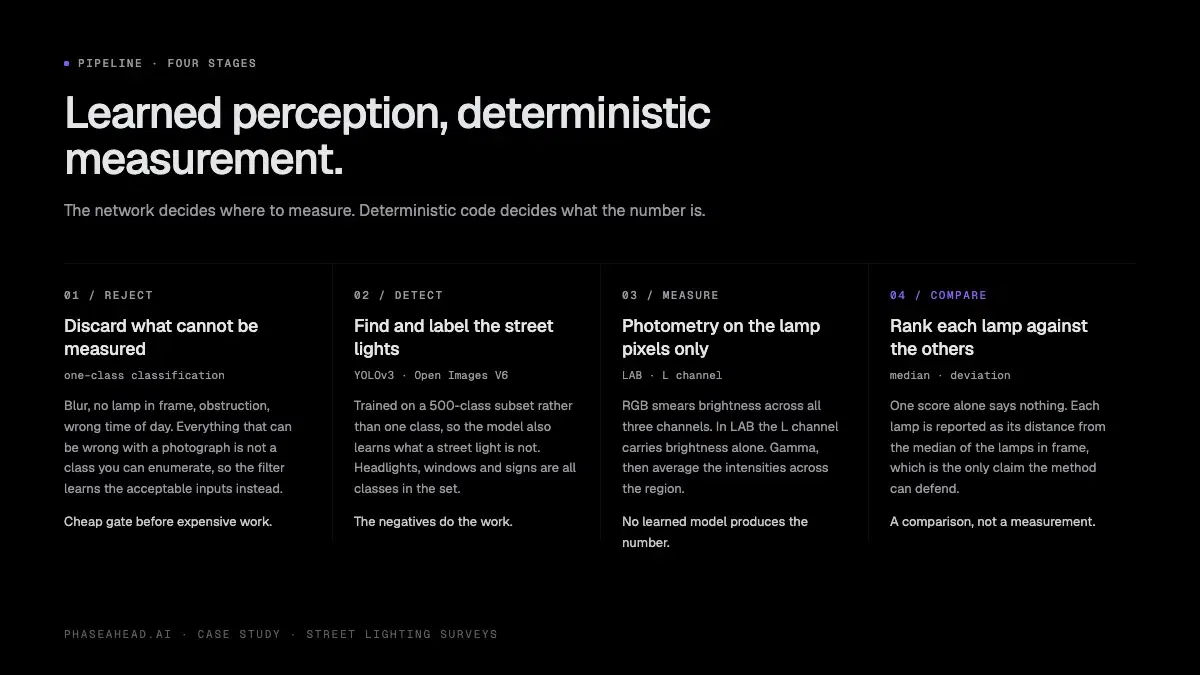
Four stages: reject, detect, measure, compare. Each one exists to hand the next a thing it can actually use, and the last one turns a number into a decision.
Reject: drop the frames that cannot be measured
A survey throws off a lot of frames with nothing measurable in them: motion blur, no lamp in view, an obstruction, glare washing out the subject, the camera pointed at the wrong part of the road, a frame shot before it was properly dark.
The instinct is to write a detector for each of those. That fails on contact with a real survey, because "everything that can be wrong with a photograph" is not a list you can write down in advance, and it changes the moment the camera, the mounting or the route changes.
One-class classification inverts the problem. Instead of learning each way a frame can be bad, the model learns the shape of the acceptable ones and rejects whatever falls outside it. There is one target class, a valid survey frame, and anything the model does not recognise as one is discarded without ever needing to be named. A blur mode nobody anticipated is rejected on the same grounds as one that was.
It sits first because it is the cheap stage and everything after it is expensive. Detection and per-lamp photometry on a frame with no lamp in it is wasted compute and, worse, a plausible-looking number attached to nothing.
Detect: find every lamp, and know what is not one
YOLOv3 locates the street lights and labels them. Detection rather than classification, because the question is not whether the image contains a street light but which pixels are one. Photometry needs coordinates.
It returns every lamp it finds, not the best one. A survey frame usually holds several poles, and each is a separate asset with its own maintenance history, so each needs its own box and its own number. One frame in, N detections out.
Training came from Open Images V6, which carries 16 million boxes across 601 classes, most of them drawn by hand. Street light is one of them. Rather than pulling it out alone, the model learned a 500-class subset that includes it.
That choice is the one that does the most work. A one-class detector learns what a street light looks like. A 500-class detector also learns what it is not, and at night that distinction is the whole problem: headlights, lit windows, illuminated signs and traffic lights are all bright blobs against a dark field. They are all in the label set, so they arrive as labelled negatives for free, and the detector learns to pass over them rather than scoring a shop window as a luminaire.
The setup is standard darknet: darknet53.conv.74 ImageNet weights, classes=500 in each
of the three YOLO layers, filters=1515 in the convolution before each one from
(classes + 5) × 3, a few thousand batches.
Measure: one number per lamp, from ordinary code
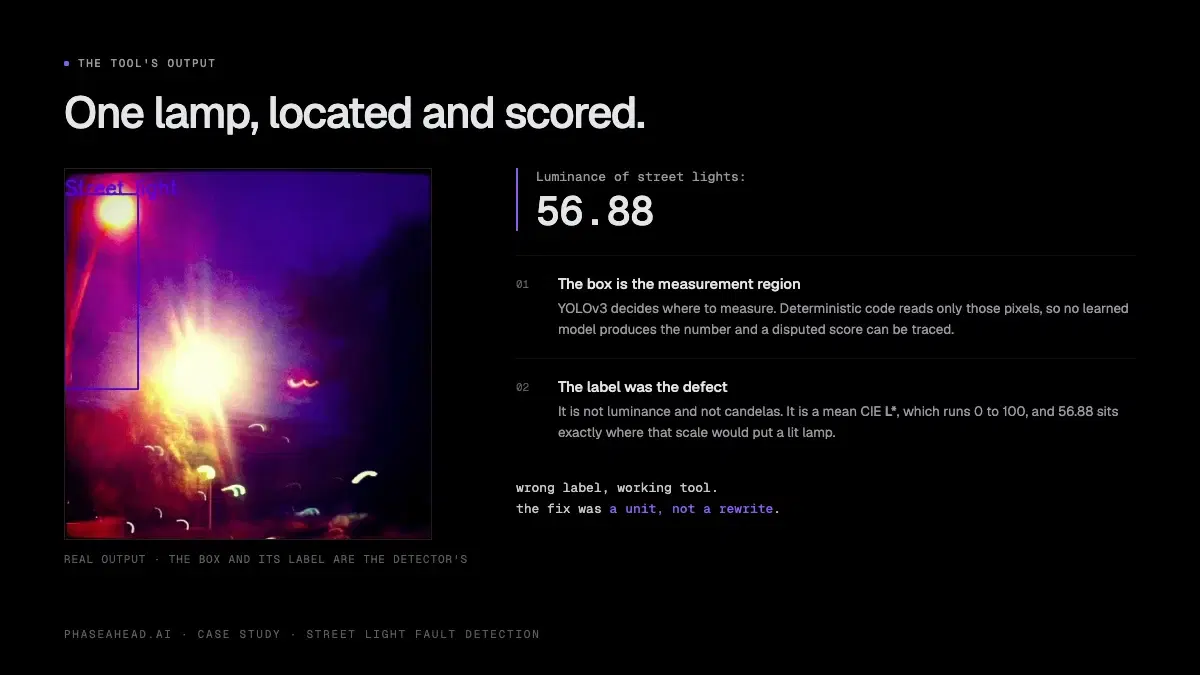
Each detection gives a box. The pixels inside it are cropped out as their own region and measured independently of every other lamp in the frame, so three lamps in one photograph produce three scores rather than one average that describes none of them.
The region converts from RGB to LAB, and the L channel is read. In RGB, brightness is
smeared across all three channels and there is nothing single to read; LAB splits lightness
into its own coordinate, which is the reason for the conversion. The L values across the
region are then averaged into one number per lamp.
No learned model produces that number. The network decides where to measure and deterministic code decides what the value is. A regression head could have output brightness directly and would have demoed fine, but "the model said so" is not an answer when a contractor disputes why a lamp scored what it scored, and a number you cannot trace is a number you cannot defend. That split is the same one that separates an AI feature you can defend from one you cannot.
Compare: rank each lamp against the ones beside it
A single score means nothing on its own. It only becomes information next to the other lamps captured in the same conditions.
Take the median of the lamps in the frame and express each one as its distance from that median. A lamp well under it is the one worth sending someone to look at. Using the median rather than the mean matters here, because the dim lamp you are hunting would otherwise drag the average down toward itself and partly hide in it.
The output of that is a sentence the method can defend: this lamp is well below the median of the lamps around it, captured at the same time by the same camera. It is not "this lamp is at 63 percent of rated output", which the pipeline has no way to know. Where the alert threshold sits is a maintenance policy rather than a photometric fact, so it belongs in configuration and should be labelled as a local rule.
What shipped, and what is design
Worth separating, because a case study that blurs the two is not worth much. The 2021 build is the detector, the per-region LAB measurement and the Flask deployment below. The one-class rejection stage was part of the project, but we no longer hold the detail of how it was built, so this piece describes the technique and does not claim a specific implementation. The comparison stage above is what the measurement was always for rather than code that shipped in 2021, and the improvements at the end of this piece are the version we would build now.
Deployment
The weights load through OpenCV's dnn module rather than darknet, served behind Flask.
That is about where a survey tool has to live. It runs on whatever laptop the person doing
the survey has, and requiring CUDA means requiring a particular GPU, a driver stack, and a
support conversation every time either changes. dnn runs the same weights on CPU.
Inference is slower, and for a batch of stills rather than a live feed, slower does not
matter.
What the brightness score is good for
A lighting department's real questions are all comparisons, and a comparative score answers a comparison exactly.
Ranking lamps before the truck goes out. Use the survey to prioritize inspection visits. A list ranked by relative brightness helps a crew choose which lamps to check first. Confirm the fault on site before deciding whether a lamp needs replacement; the image score alone cannot identify the cause or estimate the repair cost.
Finding dark gaps rather than dark lamps. EN 13201's uniformity criteria are ratios, and a ratio does not need an absolute anchor. Scoring every lamp along a route and reading the shape of the curve finds the stretch that fails while every lamp on it works.
Verifying a retrofit. Shoot a route before an LED swap and again after, with the same camera and settings. Neither number is photometric and the difference between them is still real, because the two frames carry the same distortions.
Triaging complaints. A resident reports a dark street. The score says whether that stretch is genuinely down on its neighbours or whether the complaint is about a road that was always lit to the bottom of its class.
Trending the same route over years. Repeat the survey annually from the same positions and each lamp gets a curve rather than a status. Fade shows up as a slope, which is the only form the failure ever takes.
Where the score stops
The score cannot certify anything, and no amount of implementation care would change that.
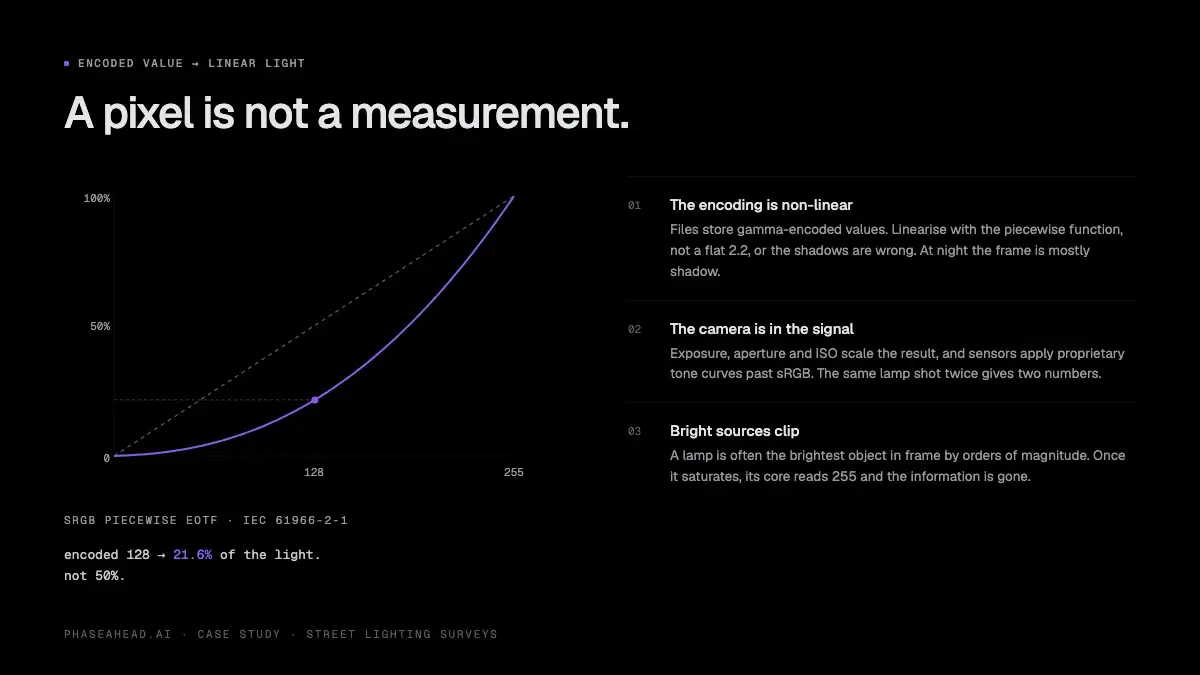
Image files store gamma-encoded values, so a pixel of 128 is about 21.6 percent of the light of 255 rather than half, and the sRGB curve is piecewise rather than a clean exponent. Exposure, aperture and ISO all scale the result, and cameras apply their own tone curves on top.
Bright sources clip, and a street light at night is the brightest thing in frame by a wide margin. Once a sensor saturates the information is gone, which destroys the measurement exactly where the subject is. A run of pixels reading 250, 253, 255, 255, 255 tells you the last three were at least as bright as the ceiling and nothing more. The brighter the lamp, the more of its core is lost that way, so the pixels carrying the most information are exactly the ones the sensor cannot record.
That one is at least cheap to detect. Count the pixels sitting at the maximum, divide by the pixels in the region, and carry the ratio next to the score. A reading that should not be ranked on then says so itself.
Real instruments are built to close each of those gaps. EN 13201 Part 4 asks for a luminance meter or an Imaging Luminance Measuring Device, which is a camera with a photopic filter, a temperature-stabilised sensor and a calibration traced to a standard, each lens calibrated separately, at a fixed height and distance.
Getting from a photograph to cd/m² means rebuilding that chain: capture RAW rather than a
rendered file, characterise how the camera responds to light, keep the exposure settings with
every frame, put a target of known luminance in the shot, and solve for the factor that maps
sensor values to physical units. Every link is a place to lose accuracy, which is why the
instruments exist and why they cost what they cost.
Two consequences for anyone deploying the tool. Never put the score in front of a contractor as evidence of a breach, because it will not survive the first challenge. And the comparison is only valid while capture stays constant, so a changed camera, a changed exposure policy or a changed mounting height voids the trend you were building. Consistency is a requirement here, not good practice.
What we got wrong: the number was not candelas
The tool prints a value like 56.88 under the heading Luminance of street lights:. We were
not certain what the unit was at the time and guessed at candelas. The heading and the guess
are both wrong, and each is wrong in its own way.
Three quantities get confused here, so it is worth separating them:
| Written | What it is | Unit |
|---|---|---|
56.88 L* | Perceptual lightness, a coordinate in CIELAB | none, it is dimensionless |
56.88 cd | Luminous intensity, light leaving a source in one direction | candela |
56.88 cd/m² | Luminance, what a surface sends back to an eye or a lens | candela per square metre |
The pipeline produces L*. A candela measures a source, not the road surface a driver
actually sees, so the guess named the wrong thing rather than the wrong unit for the right
thing. Luminance is what a survey wants: it is what EN 13201 is written in and what a
luminance meter reads.
Nothing here can produce that. L* is dimensionless, so there is no conversion from it to
cd/m², not a lossy one and not an approximate one. The perceptual curve threw away the
scale a physical unit would need.
Converting to LAB to isolate brightness was the right instinct. The problem is what L* is.
It is defined as 116 · f(Y/Yn) − 16, a
cube root above a threshold and a straight line below it, giving an effective power curve
near 0.43. That curve is Stevens's power law: perception is compressive, so doubling the
light does not double the apparent brightness. The anchor most people know is that an 18
percent grey card reads L* = 50. A surface returning under a fifth of the light looks half
as bright as white. L* is a deliberate distortion fitted to the eye, and reading it back as
a physical quantity runs the model backwards.
Two things go wrong in practice.
L* is a ratio against a reference white, Yn, that you have to supply, and a night frame
has none, because the brightest thing in it is the lamp and the lamp is saturated.
Normalising against a clipped value is not a normalisation.
And the gamma applied after the conversion is a second perceptual correction. The reasoning
behind it was right on the physics, since sensors are linear and eyes are not, but the cube
root inside L* had already done that job. The curve gets applied twice. The order is what
makes it wrong rather than the gamma itself: linearisation belongs before the colour
conversion, on the encoded pixel values, where it undoes what the file format did. Applying
a perceptual curve after L* applies a second one to a number that is already perceptual.
That second one is a real computational error, not just a mislabel. It lands on every region
identically, so it does not necessarily disturb the ranking that the comparisons depend on,
but it is not guaranteed to preserve it either: the curve acts on pixels while the score is
an average over them, and two lamps with differently shaped pixel distributions can move
relative to each other. So the number should not be read as a clean L*, and the ranking is
worth re-deriving on a corrected pipeline rather than assumed to have survived. What shipped
wrong on top of that was the word above the number. The page read Luminance of street lights:, and the number under it was never a luminance.
What we would do differently
Name the scale in the interface. The page read Luminance of street lights: above the
value. It should have read Mean L*, relative, and the value should have carried its scale:
56.88 L*, not 56.88. Almost all of the confusion here was that missing label rather than
a wrong method, and a unit next to a number is the cheapest documentation there is.
Report the deviation, not the score. A bare 56.88 invites the absolute reading that
caused the problem in the first place. Reporting each lamp as its distance from the median of
the lamps around it puts the comparison in the output itself, and the comparison is the only
claim the method can actually defend.
Carry a saturation ratio with every value. The mean hides the clipping problem, and clipping is the failure that bites hardest here because it grows with the brightness of the lamp. Store the share of pixels at the ceiling next to each score, along with the median and the tails, and a reading that should be distrusted announces itself instead of quietly ranking wrong.
Aggregate per lamp, not per frame. On a moving vehicle the same pole shows up in several consecutive frames at different distances and angles. Track it across them and take the median of its scores, so one badly timed frame stops deciding a lamp's rank.
Put a calibration card in frame. A reference of known reflectance in every shot is the entire distance between a comparative number and an absolute one, and it costs nothing to carry.
Replace the detector. A street light in a real survey frame is small, distant and high up, and small objects are this architecture's documented weak spot. Current work targets exactly that: BFRI-YOLO reports mAP@0.5 of 42.1 percent on VisDrone2019, 8.8 percent over its YOLOv11n baseline, using a resolution-aware feature pyramid. Others get there by adding a high-resolution detection head for tiny targets. Those are aerial-imagery benchmarks rather than street-light ones, so read them as evidence that the small-object problem is being worked on, not as a score this job would reproduce. Worth keeping the ceiling in view, though: a 2026 benchmark across YOLO generations found aerial small-object scores stay low for every architecture and scaling model capacity yields only gradual improvement. Better, not solved.
Bottom line
Five years on, the published state of the art for drive-by street light surveys is still answering the easier question.
A 2026 edge deployment in Bengaluru mounts a camera on a vehicle, covers 16.6 kilometres of road and runs YOLOv5nu at mAP50 of 0.886 to classify each lamp ON or OFF. Its own future work asks to "extend the label set beyond binary ON/OFF to include partial fault, flickering, and dim lamp classes for more actionable maintenance." A 2025 study in Astana built a dataset of 4,260 annotated dashcam frames and a squeeze-and-excitation variant of YOLO for the same detection job.
Both are better engineered than what we shipped in 2021, and both are answering "is it on". The Bengaluru team already knows that is the wrong question, which is what its future work says out loud. "How far down is it" is the one the maintenance standards ask. A lamp at 75 percent of rated output is lit and failing at the same time, and a survey that only counts outages will never send a truck to it.
If you are scoping a lighting survey system, the question worth asking a vendor is what their tool does with a lamp at 75 percent. If the answer is that it reports the lamp as working, you are buying an outage counter. Whether you need a comparative score or a certified measurement changes the hardware bill by an order of magnitude, and it is worth settling before anyone quotes you. That decision is the same class of call as working out where AI does not pay off: cheap to get right on paper, expensive to discover after the purchase order.
Sources
- US Department of Energy: LED Luminaire Reliability, on why end of life is set at L70
- Pacific Northwest National Laboratory, 2013: Lumen Maintenance and Light Loss Factors
- Sustainability (MDPI): Measuring Average Luminance for Road Lighting from Outside the Carriageway
- CEN: EN 13201-4:2015, Road Lighting, Methods for Measuring Performance
- GL Optic: Road lighting luminance measurement with an imaging luminance meter
- Google: Open Images V6 facts and figures
- W3C: A Standard Default Color Space for the Internet, sRGB
- CVPR 2017: Why You Should Forget Luminance Conversion and Do Something Better
- Wikipedia: CIELAB color space
- Electronics (MDPI), 2026: BFRI-YOLO, small object detection in aerial imagery
- arXiv, 2026: YOLO26 vs YOLOv8, an architectural benchmark
- Symmetry (MDPI), 2025: Applying Computer Vision to the Condition and Operation of Street Lighting
- Edge AI, 2026: Nighttime Street Light Functional Audit System
Common questions
How do you detect a street light that is dim but not burned out?
How do you detect a street light that is dim but not burned out?
You have to measure each lamp rather than classify it. A detector locates the lamp pixels in a night photograph, then deterministic code reads a brightness value from only those pixels. Scoring every lamp the same way turns a dim lamp into a low number next to its neighbours, which no on-off check can produce.
Why can't a maintenance crew just see which street lights are dim?
Why can't a maintenance crew just see which street lights are dim?
Because the industry's own wear-out threshold sits at the edge of human perception. The US Department of Energy sets end of life at L70, meaning 70 percent of initial output, and chose 70 percent because the typical eye does not detect a drop until it exceeds 30 percent. Every lamp between new and worn out is losing light invisibly.
What is the L70 rating for a street light?
What is the L70 rating for a street light?
L70 is the number of operating hours before a luminaire falls to 70 percent of its initial light output. It matters for surveys because LEDs rarely fail dark; they fade over years, so a lamp can sit below the level its road was certified to hold while still looking lit.
Can you survey street lights from a moving vehicle at night?
Can you survey street lights from a moving vehicle at night?
Yes, and it is now the common approach. Published systems mount a camera on a city vehicle and run detection on the footage, covering a route in a night that a compliant instrument would take weeks to cover. The catch is that most of them report only whether each lamp is on.
Do you need a luminance meter to check EN 13201 compliance?
Do you need a luminance meter to check EN 13201 compliance?
For a compliant reading, yes. EN 13201 Part 4 asks for a luminance meter or an Imaging Luminance Measuring Device, which means a photopic filter, a temperature-stabilised sensor, per-lens calibration traced to a standard, and fixed geometry. A camera score can rank lamps against each other, but it cannot certify one.
What does the CIE L* value measure, and is it luminance?
What does the CIE L* value measure, and is it luminance?
CIE L* is perceptual lightness on a 0 to 100 scale, not physical luminance. It applies an effective power curve near 0.43 fitted to the eye, so doubling the light does not double L*. It is a model of how bright something looks, which is why reading it back as candelas inverts the model.